Learn to use cycle metrics features to track performance cycle progress, identify trends, and make data-driven decisions, with the option to export data at any time.
Access the Metrics tab
Supervisors and employees with edit rights for cycles can access the Metrics tab. There, they only see data for employees whose section containing the Status attribute they have View permissions to.
To access the Metrics tab for a specific cycle, follow these steps:
- Go to Performance > Review Cycles.
- Click the relevant cycle.
- The cycle details page opens. Click the Metrics tab.
Tip:
Click the three-dots icon on any chart to download it as PNG, CSV, or Excel. In the Review results section, you can also select View underlying data to see a detailed per-participant breakdown.
Track cycle progress
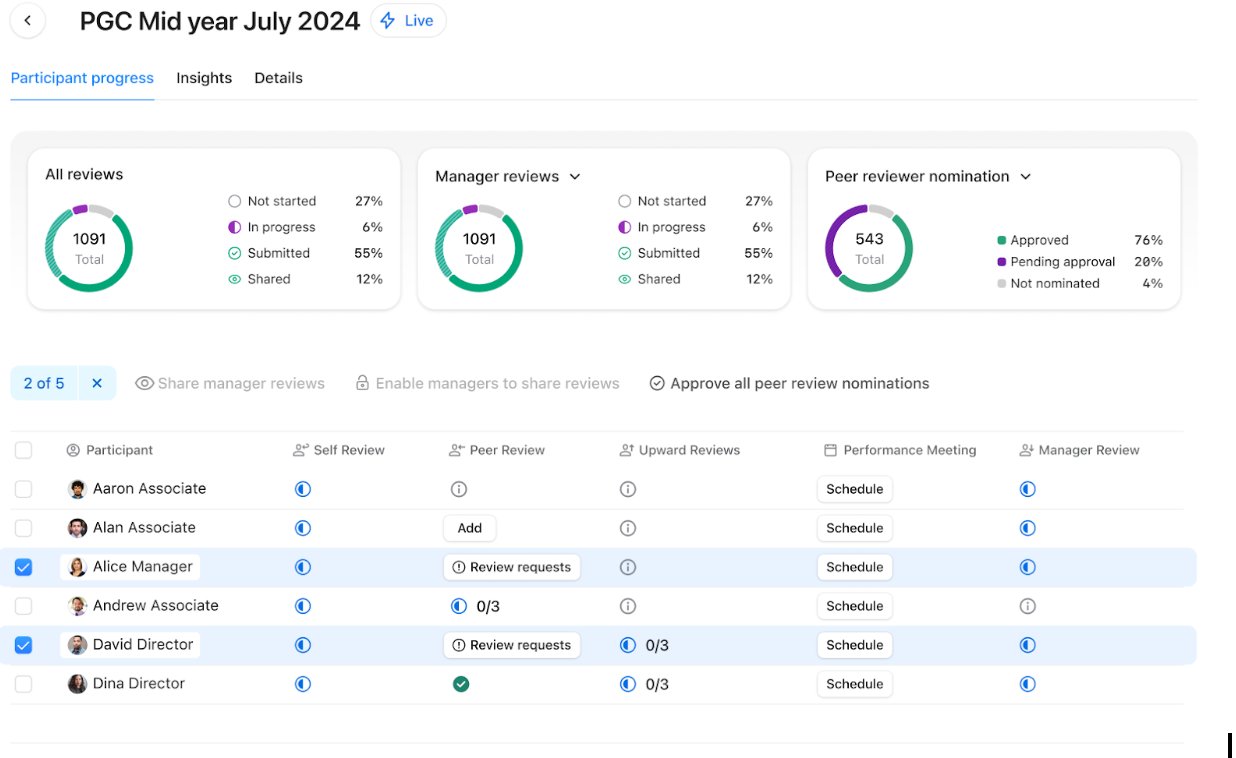
Under Metrics > Cycle progress, you can see an overview of the progress by review type. The page displays segmented data with ring graphs, with different colors to indicate the review status (Not started, In progress, Completed).
For peer review, you can also track the progress and status of nominations.
See review results
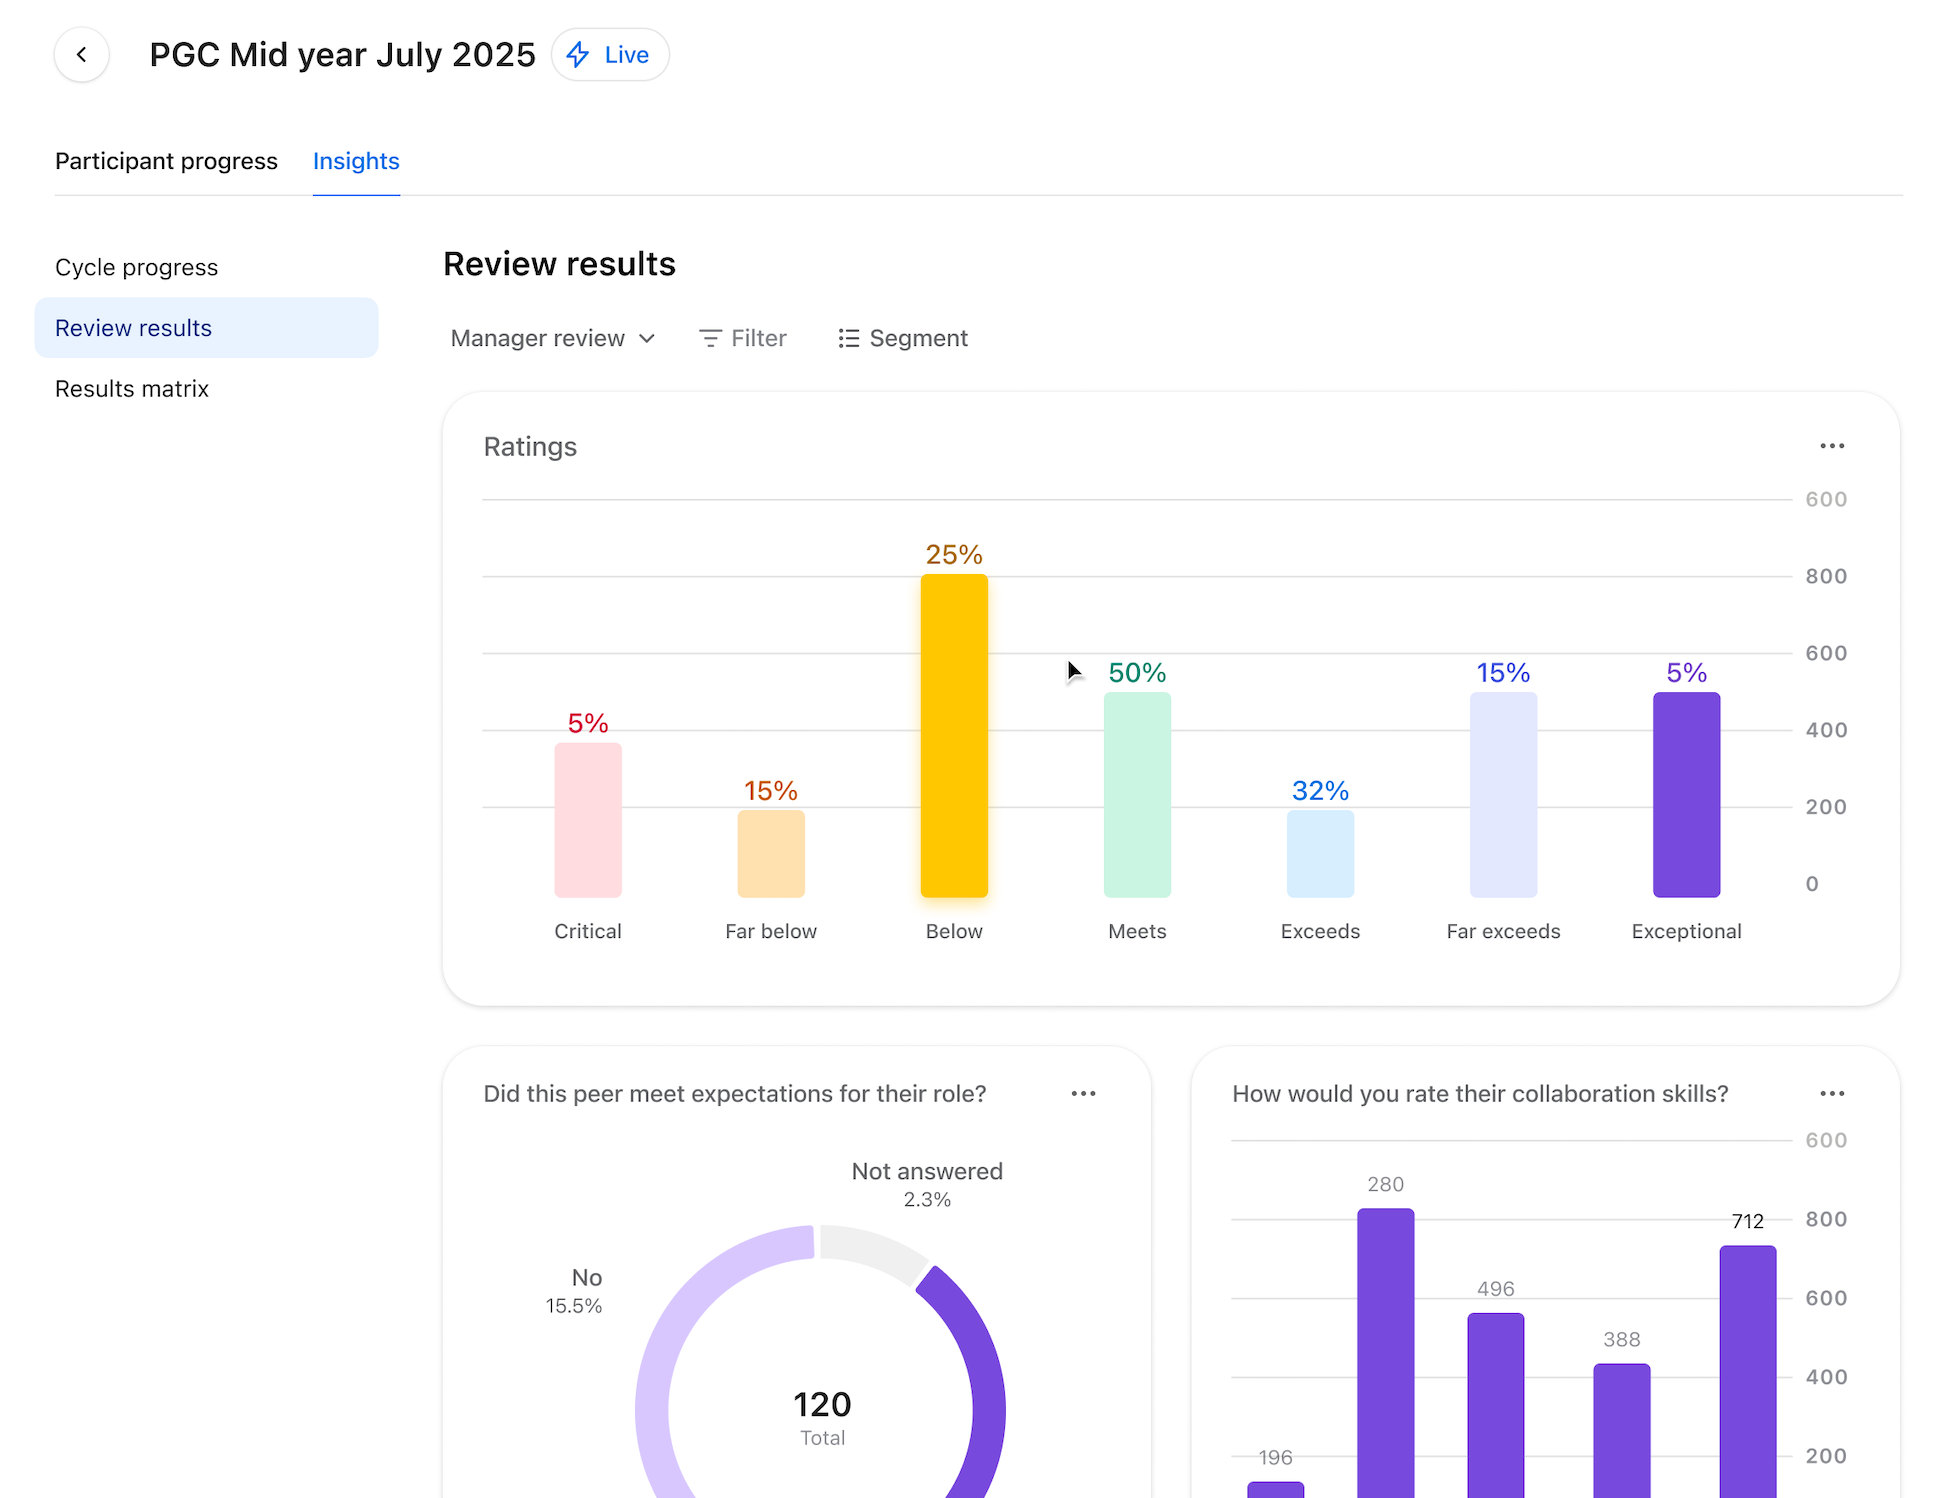
Under Metrics > Review results, you can see an overview of all answers to all structured questions in the cycle. This includes scale, numeric, traffic light and binary questions, and performance ratings. The view includes:
- The distribution of all performance and potential ratings in the cycle.
- The answer distribution for each structured question.
Compare questions
Under Metrics > Results matrix, you can see the distribution of employee ratings from two different questions. These questions can be scale, numerical, traffic light, or performance rating questions.
The matrix (also known as the 9-box grid) comes pre-populated:
- If both performance and potential ratings are active, the performance rating appears on the x-axis. The potential rating appears on the y-axis.
- If only performance ratings are active, they appear on one axis. The first scale question from the manager review appears on the other axis.
- If there are no performance ratings, Personio uses the first two scale questions from the available reviews in this order: manager, self, peer, or upward review.
You can choose one question for the horizontal axis and another for the vertical axis.
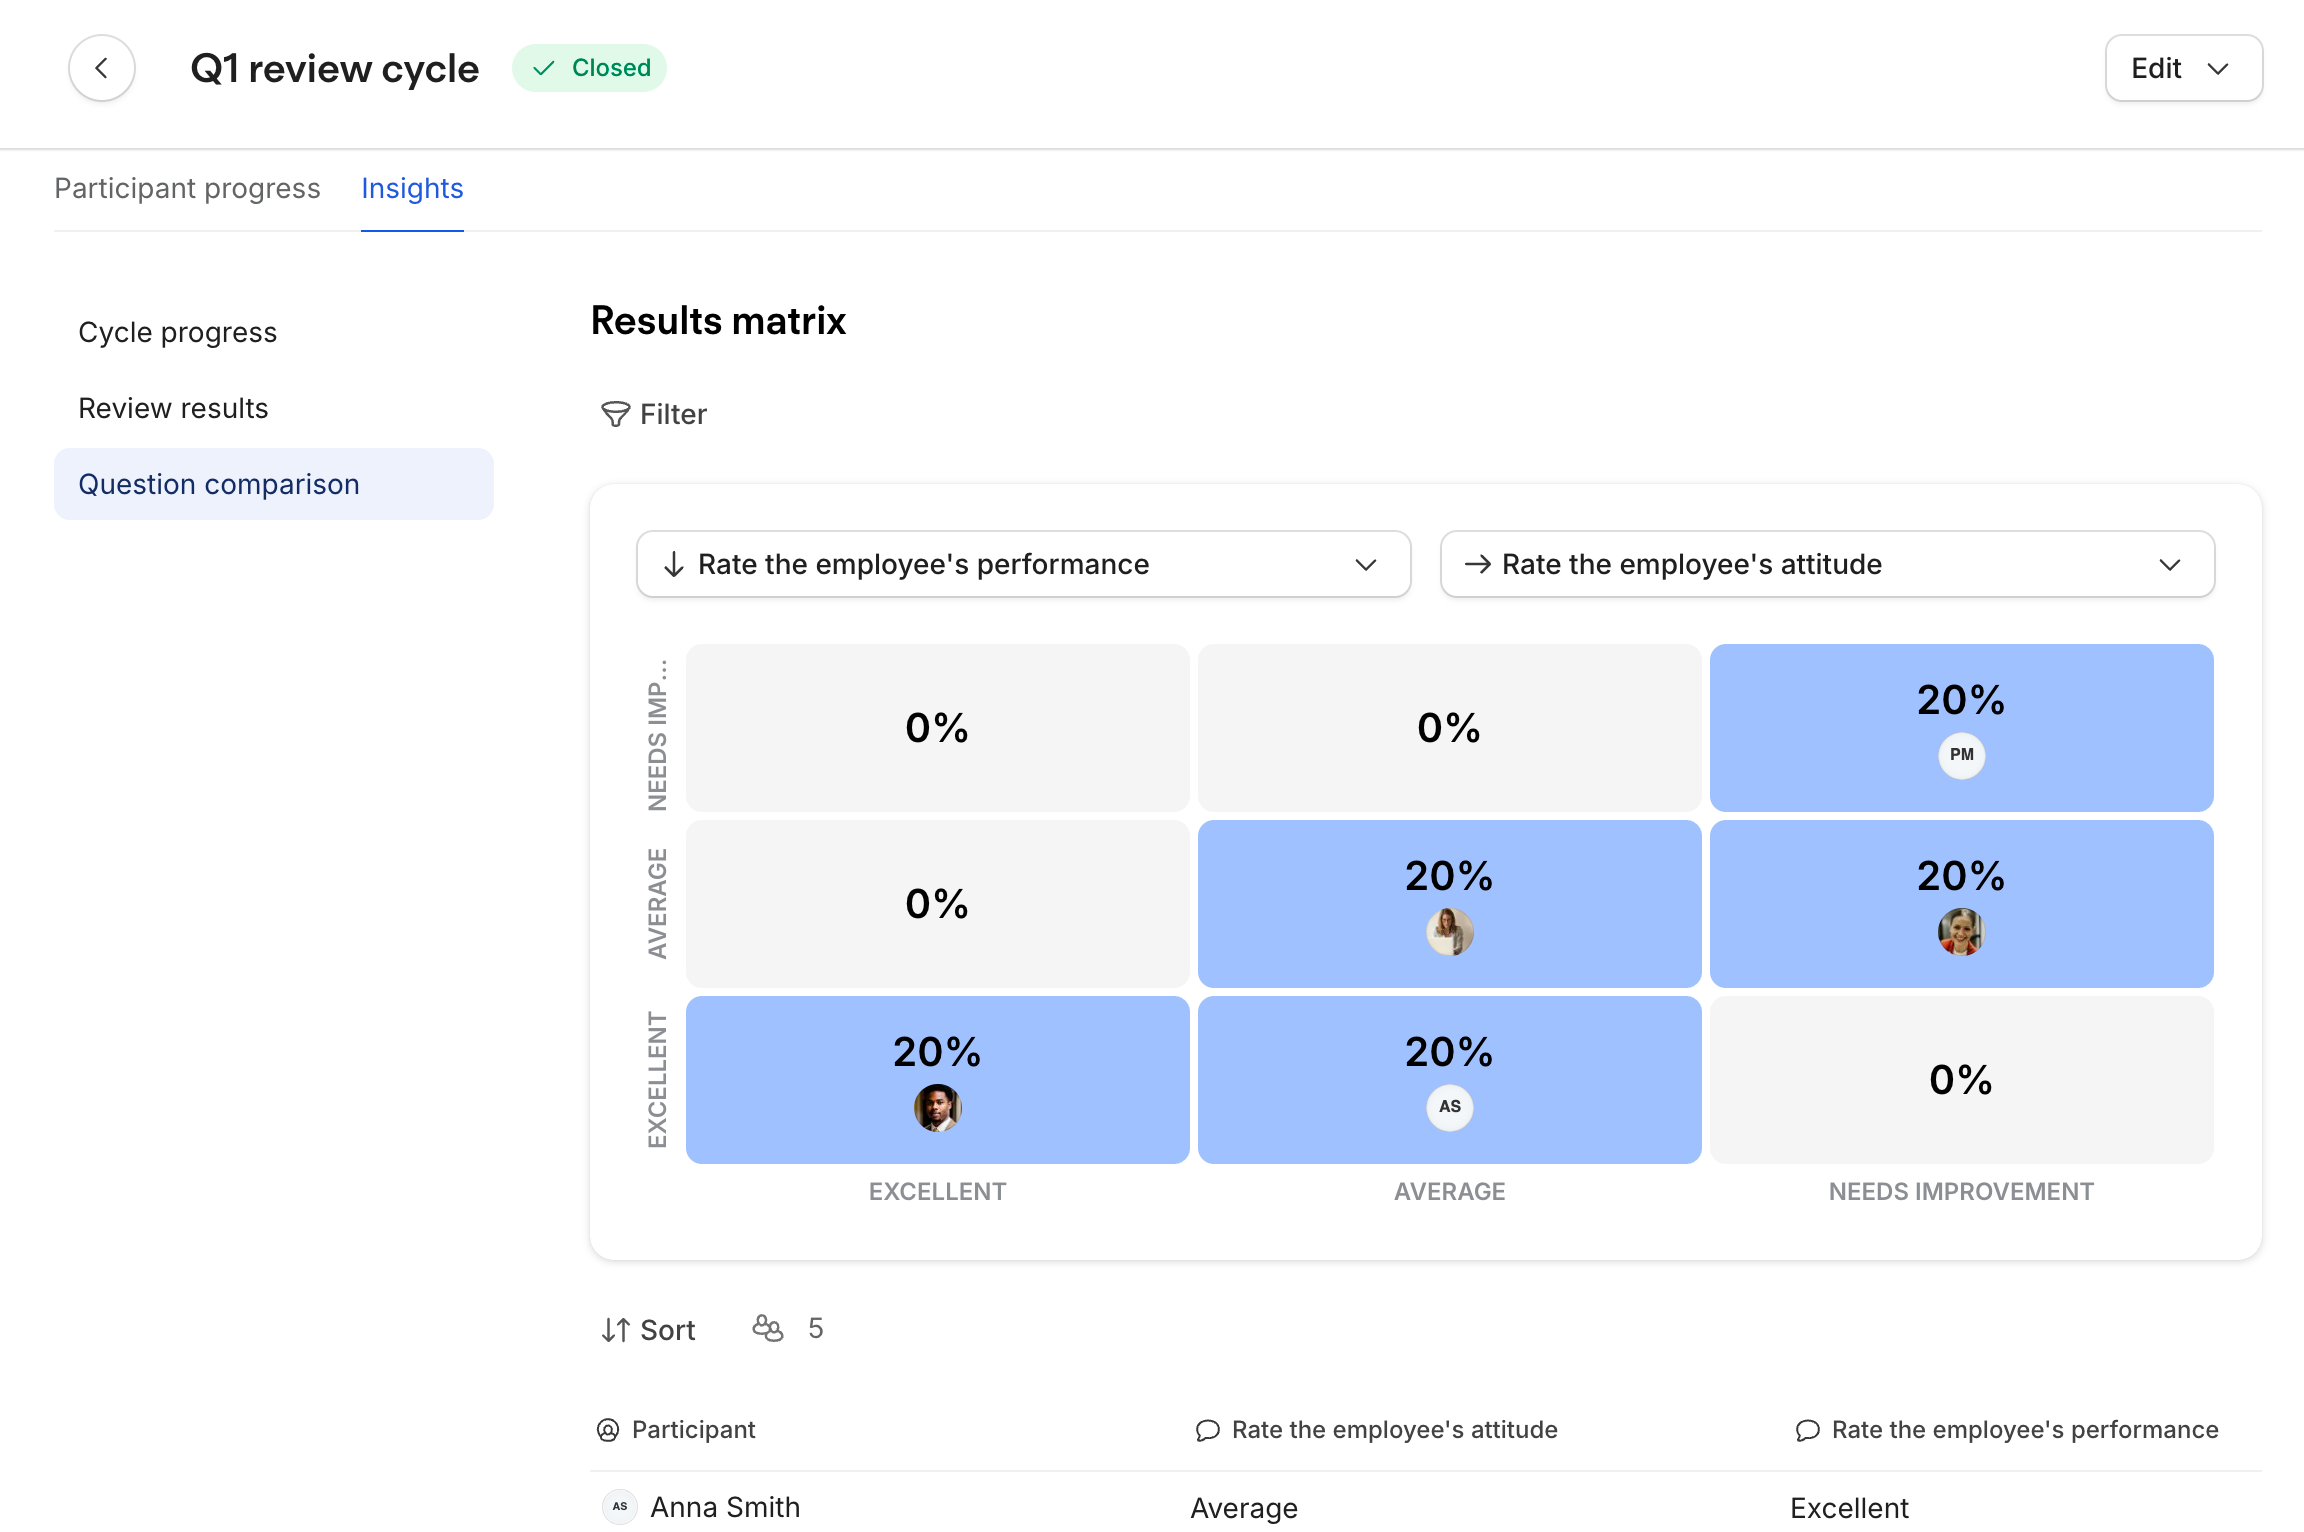
The combined ratings of both questions determine the position of each employee on the matrix. Top performers appear on the upper-right-hand side of the matrix, while employees with lower ratings are displayed on the lower-left side.
You can filter the matrix by supervisor and by team, department, legal entity, or workplace.
Tip:
The matrix is type of graph called a box grid. It's useful when you assess employee performance and potential for growth, and during calibrations. Learn more about this powerful instrument.